Organizational Structure Redesign
Structures, spans of control and governance models aligned to strategy, with payroll cost and decision speed as design metrics.
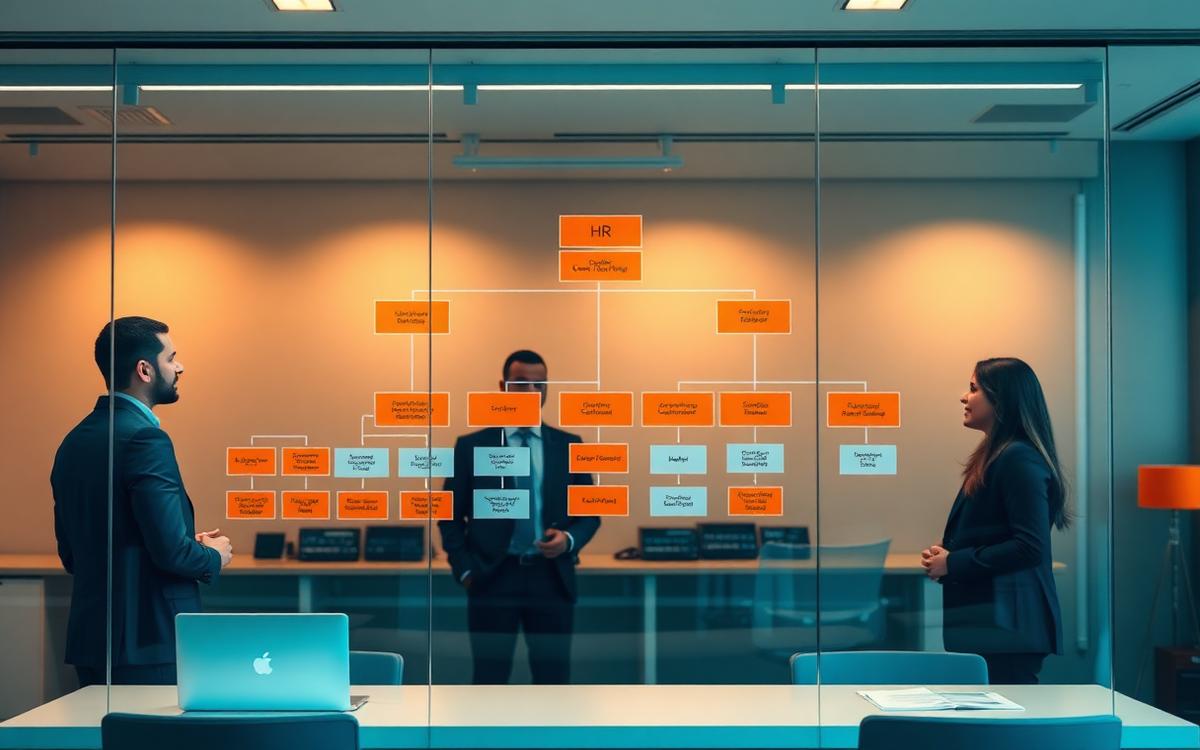
The challenge
Structures grow by accumulation: layers added with every reorganization, uneven spans of control and decisions that climb three levels before being made.
Our approach
- Diagnostic of layers, spans of control and structure cost by function
- Map of critical decisions and where they should actually be made
- Design of the target organization by blocks and headcount sizing
- Transition plan, governance and management of people impact
Deliverables
- Spans & layers diagnostic with cost per layer
- Target org chart and headcount sizing
- Decision and accountability matrix (executive RACI)
- Transition plan with sequence, risks and expected savings
Structure to Strategy
Structure is designed after the decision, not before.
We first define which decisions create value and who should make them; only then do we draw boxes, layers and reporting lines.
Structure X-ray
We measure layers, spans of control, duplications and structure cost by function and unit, benchmarking them against sector references.
- Spans & layers analysis
- Structure cost by function
- Map of duplications and overlaps
Decisions and accountability
We identify the decisions that move the bottom line, the level where they should be made, and the information required so they don't escalate.
- Critical-decisions map
- Executive RACI
- Decision-bottleneck diagnostic
Target organization
We design the structure by blocks — what gets centralized, what gets federated and what gets outsourced — and size headcount using demand drivers.
- Design by blocks and service centers
- Sizing by activity drivers
- Leadership and competency model
- Job profiles and bands
Controlled transition
We sequence the rollout by waves, with governance, communication and control of one-off cost against recurring savings.
- Implementation wave plan
- Reorganization business case
- Four-pillar HRBP model (Ulrich)
- Headcount and cost tracking dashboard
S2S·NS methodology path
Sequence of phases, with the analytical focus of each one and the decision point that closes it.
Fig. 1 · Phase flow
Layers and spans of control
The redesign is measured in layers removed and standardized spans. The NS benchmark puts middle-management span near five direct reports, expandable to eight in simplified organizations.
Fig. 3 · Spans & layers: current vs. target structure (positions by layer)
Reference ranges behind the framework
Index values from the NS engagement base that we use to calibrate hypotheses and targets before measuring with the client's own data.
typical span of control for middle managers versus what simplified organizations sustain
NS Base · Organizational Designof structural cost freed up by standardizing spans and removing redundant layers
NS Base · Organizational Designmost organizations adjust their structure every one to two years: design is a process, not an event
NS Base · Organizational DesignFig. 4 · NS reference ranges
Deliverables map
Each deliverable is anchored to the phase where it is produced and validated with the client team.
Fig. 2 · Deliverables by phase
The figures use reference ranges and index values from the NS method, calibrated with our project base and market tracking. Each project's results are reported with the client's actual figures.
Lead partner
Santiago Noriega
Organizational capability: structure, talent, rewards and culture.
See partner profilesAI as an accelerator in this practice
Accelerated organizational diagnostics with network analytics and sizing models.
- Span of control, layers and duplication analysis over payroll and HCM data
- Organizational Network Analysis to see how work actually flows
- Workforce sizing models driven by demand drivers
- Structure and cost scenarios compared in minutes
We work with data governance, confidentiality controls and human validation on every deliverable: AI accelerates the analysis, it never replaces the decision.
Insights from this practice
Frameworks and criteria we use on projects, explained in detail.
Layers and spans of control: the diagnosis that precedes the org chart
Before drawing boxes, it's worth measuring how many layers separate leadership from the customer and how many direct reports each manager has. There are almost always more layers and narrower spans than the organization believes.
6 min readOrganizational designDecision rights: what must be defined before moving the org chart
Most reorganizations change reporting lines and leave decisions untouched. Six months later, the same issues are still escalating to the same committee.
5 min readOrganizational designSizing headcount with demand drivers, not with history
Budgeting next year's headcount as last year's plus a percentage perpetuates all accumulated inefficiency. Drivers let you defend every position.
5 min readLet's talk about your specific case
A first conversation is enough to size the opportunity.